- Contact
- About
- Services
- Blog
- Login
- Menu×Market Insights
How population patterns shape housing markets
01 May 2024 |5 Minutes Read
Australia, known for its vast expanses of land and unique landscape, is experiencing a fascinating shift in population density.
With the nation undergoing its fastest rate of growth since the 1950s, cities and towns are naturally becoming more densely populated. However, the distribution of this population density is far from uniform, and it is having a significant impact on housing trends across the country.
At a national level, Australia's population density of 3.5 people per square kilometre (sq. km) is among the lowest in the world. This figure highlights the country's highly urbanised population, with half of its residents living in the three largest cities. Remarkably, 75% of Australia's population resides on just 2.6% of the land mass, emphasising the concentration of people in urban areas.

When examining population density at the capital city level, some surprising findings emerge. Melbourne, not Sydney, takes the top spot with 521 residents per sq. km. Adelaide follows closely with 444 people per sq. km, while Sydney comes in third with 441 residents per sq. km. This ranking may come as a surprise, given that Sydney has a larger portion of medium to high-density housing stock (39.5% compared to Melbourne's 33.4%) and generally smaller block sizes.
However, Sydney's lower population density can be attributed to its larger metropolitan area, which includes regions like the Central Coast, Blue Mountains, Penrith, and Sutherland, covering a total of 12,369 sq. km.
Every capital city in Australia is experiencing a rise in population density, but the manner in which this is occurring varies from region to region. Perth, for example, has recorded the largest increase in population over the past 20 years, with a 54.4% growth.
Despite this, Perth has the highest portion of detached houses among the capitals, making up 85.5% of its housing stock. Rather than building vertically, Perth has densified through smaller block sizes for detached housing and a sprawling urban footprint, with the population spreading to the northern and southern fringes of the city.
In contrast, the Australian Capital Territory (ACT) has seen a different approach to densification. The share of medium to high-density housing stock in the ACT has risen from 25.1% ten years ago to 34.2% in 2024. However, the median block size for houses sold over the past 12 months remains among the highest of any capital at 750 sq. m, indicating a balance between vertical growth and spacious living.

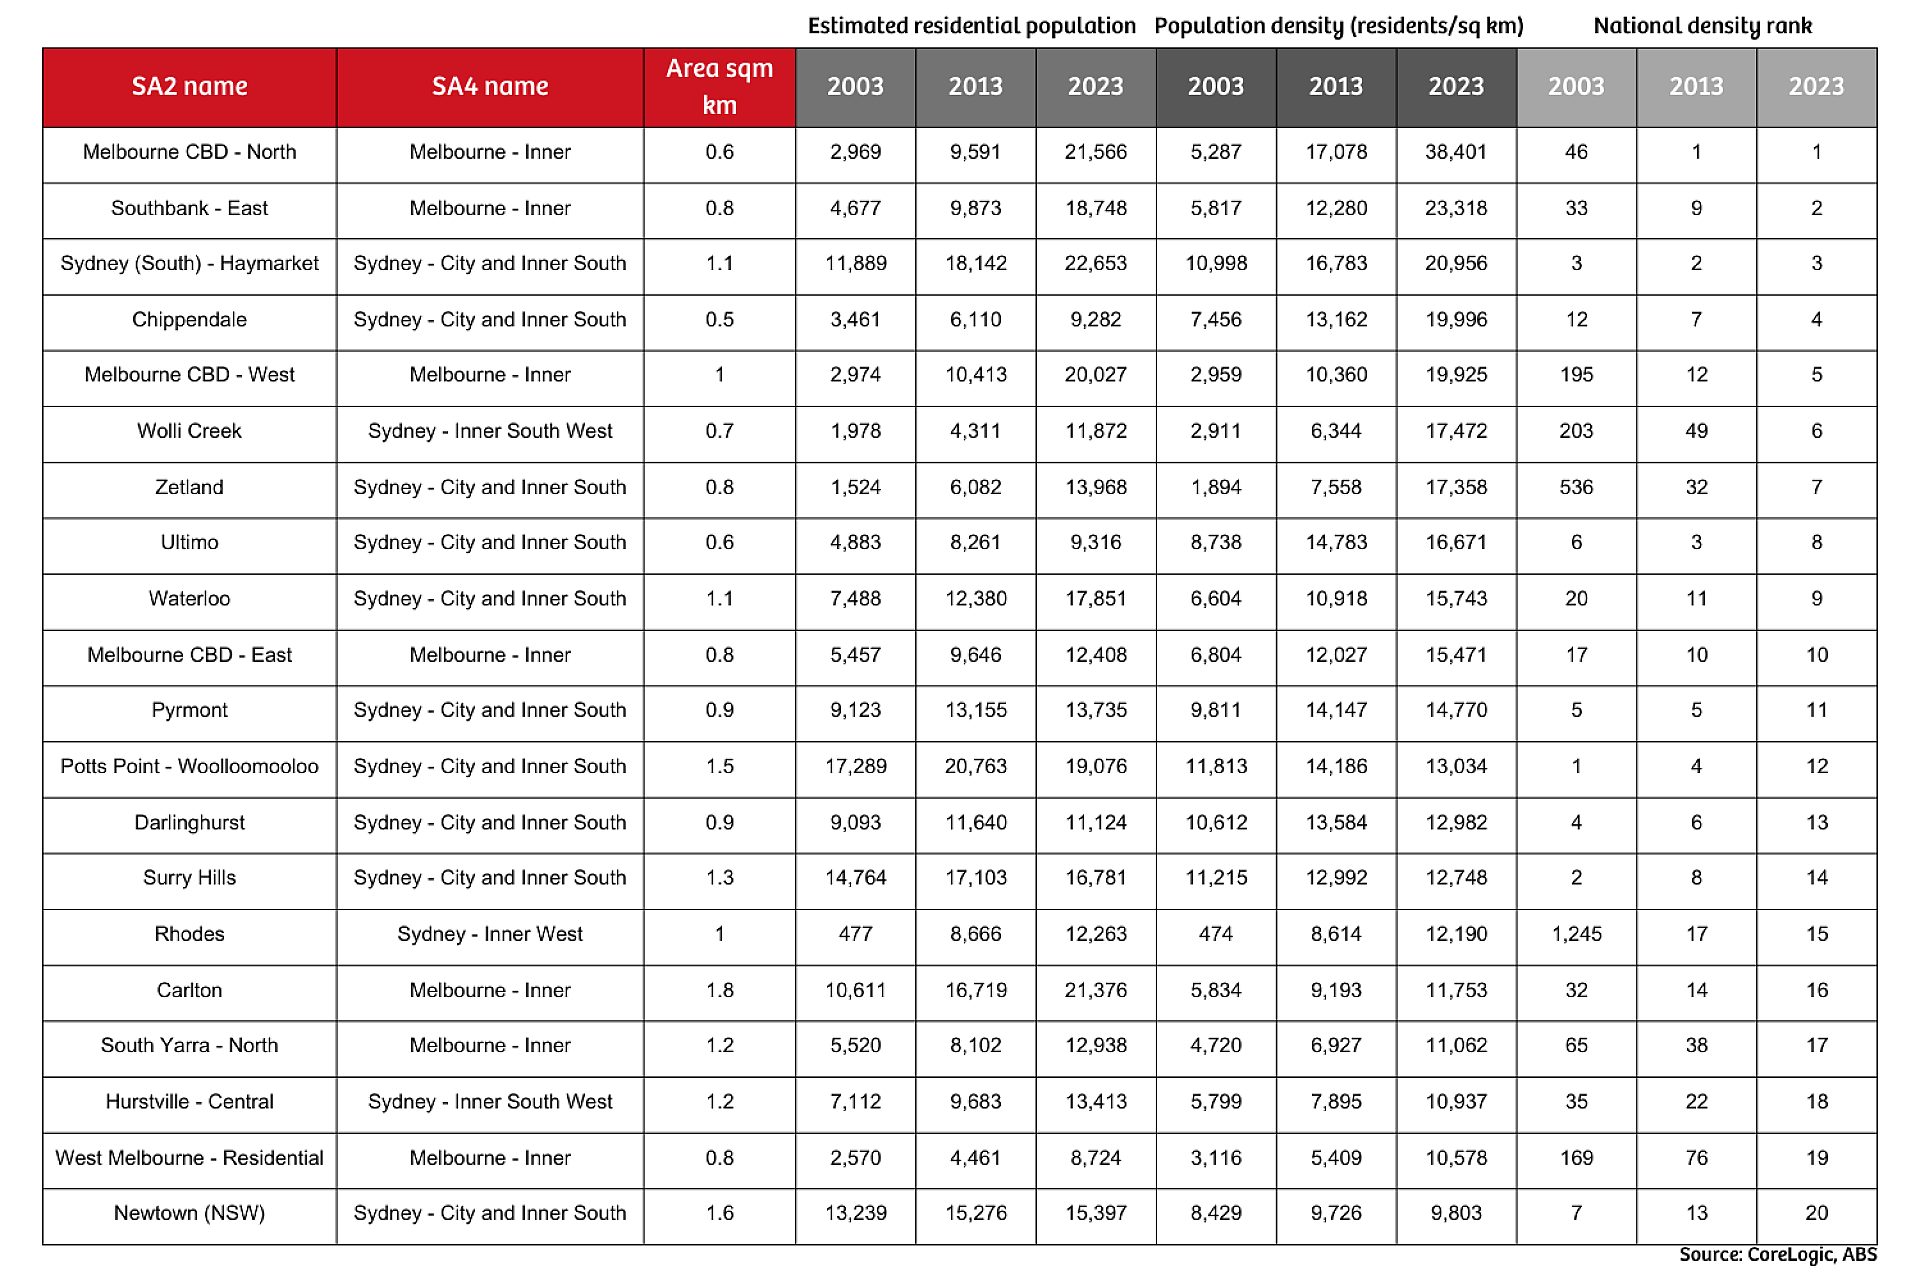
When analysing population density at a more granular level, inner-city precincts of Melbourne and Sydney dominate the highest-density locations nationally. However, the rankings have undergone remarkable changes over the past 20 years. In 2003, Sydney comprised 19 of the top 20 SA2s (Statistical Area Level 2) with the highest population density, with Melbourne's CBD-East being the only non-Sydney area, ranked 17th. Fast forward to 2023, and Sydney now occupies 13 of the top 20 spots, while Melbourne has claimed seven, including the top two positions.
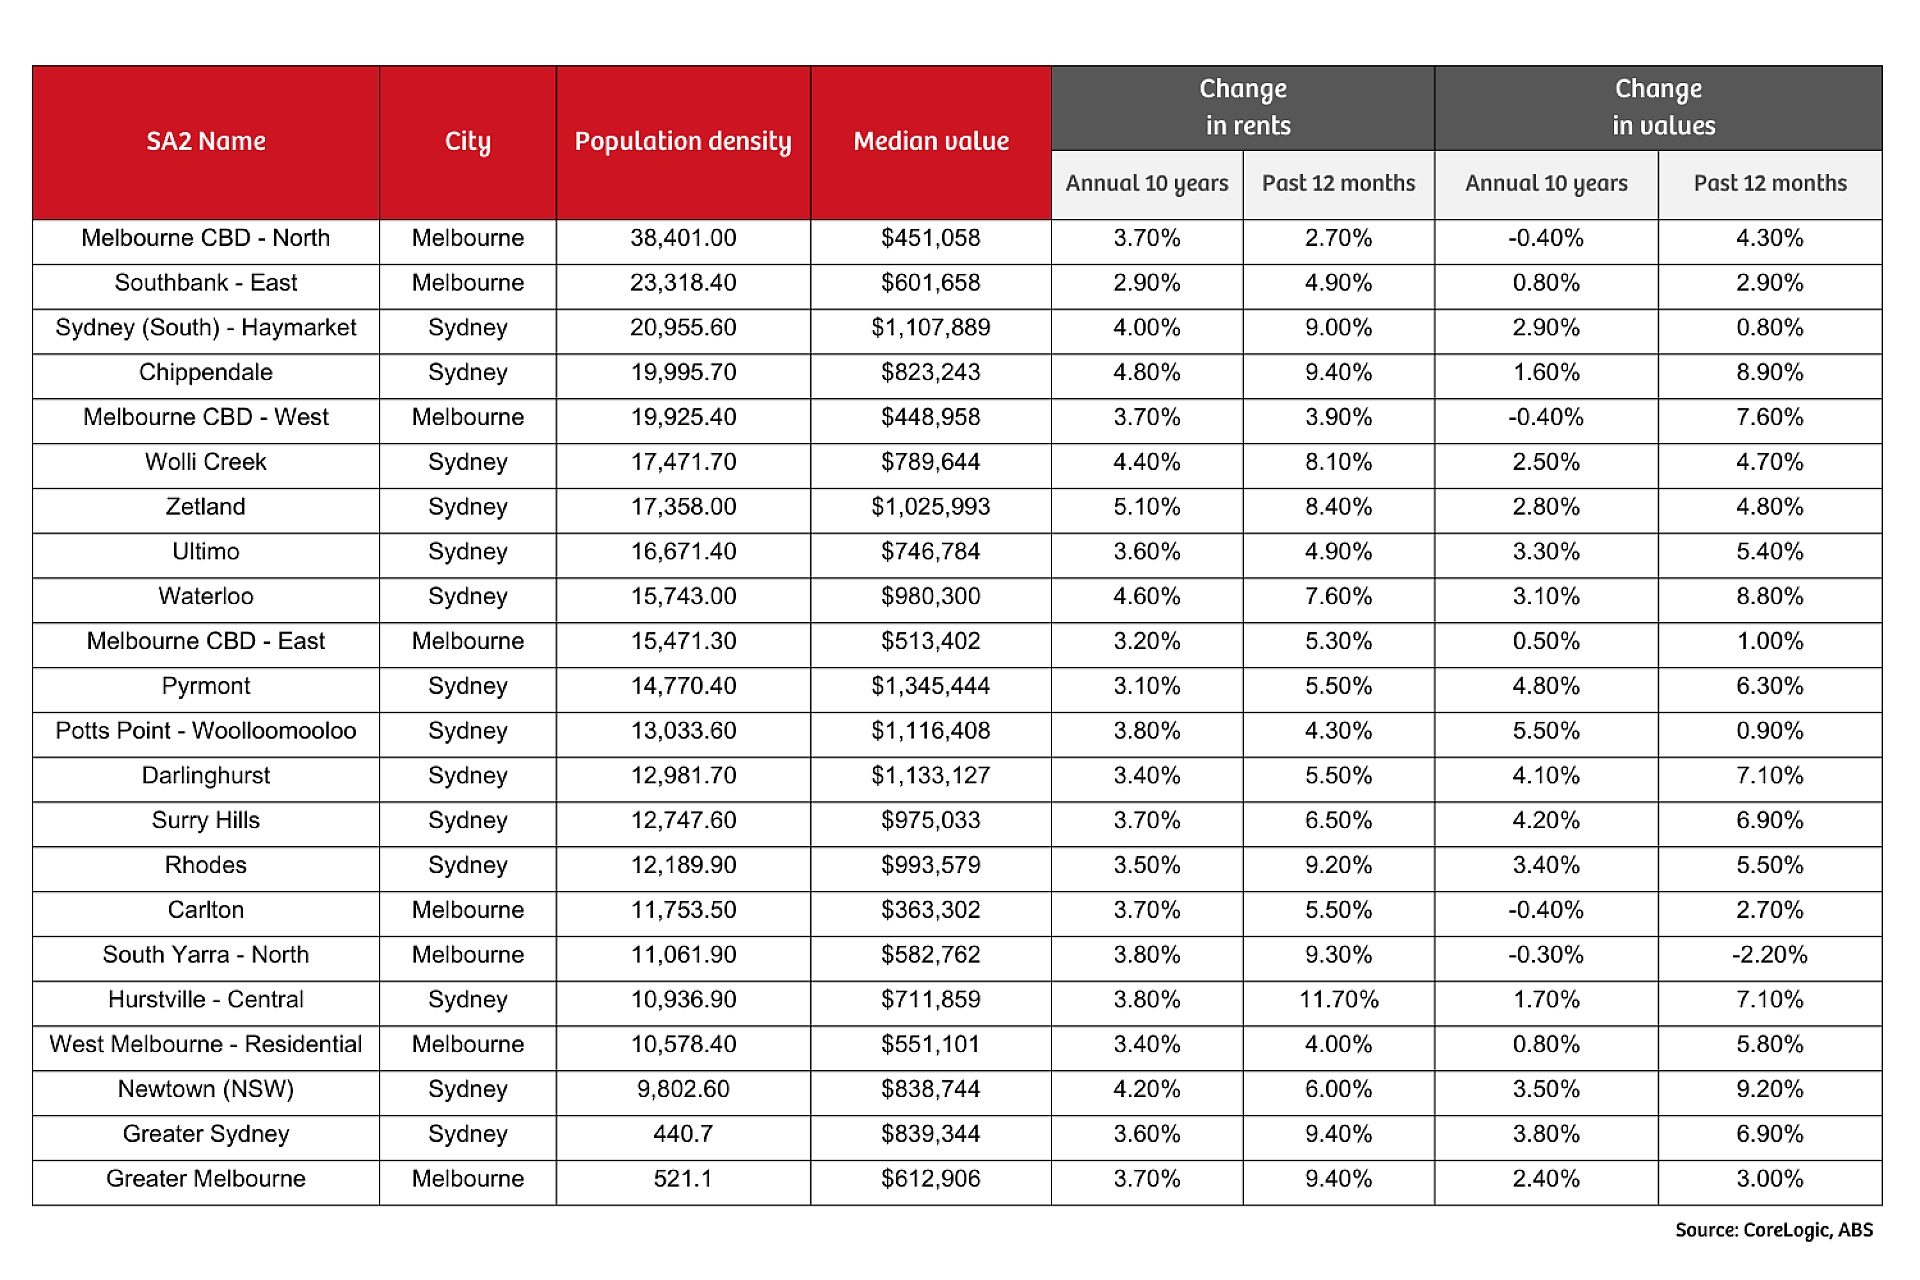
The relationship between population density and housing trends is complex and varies depending on the type of housing.

When it comes to unit values, the relationship with population density is more significant. High-density unit markets generally show a lower level of value growth over both the past 12 months and the past 10 years, with the longer-term relationship being more pronounced. This trend may reflect periods of higher unit supply weighing on value appreciation.
Sixteen of the top 20 high-density SA2 locations have recorded a lower annual rate of unit value growth over the past decade compared to the broader capital city trend. In contrast, population density has virtually no explanatory power for house values.
While precincts with high population density tend to show slightly stronger growth in unit rents over the long term, they also exhibit softer rates of capital appreciation across the unit sector. This trend can be attributed to the high level of amenity, proximity to major employment nodes, and academic facilities typical of high-density precincts, making them popular among a broad range of cohorts, including students, inner-city professionals, service workers, and migrants.
However, the softer value growth, despite generally high levels of population growth and strong rental demand, may be due to the propensity for higher levels of new housing supply in these same precincts.
New supply, especially in the high-rise sector, can be "bulky," delivering hundreds or even thousands of new dwellings to a market in a relatively short period.
Delete alertGet property alerts
Get email alerts as soon as properties matching these criteria become available.
$$Send alerts to:
Create an account or login to add properties to wishlist
Create an account or login to add properties to a wishlist. Sign up for property email alerts as soon as properties matching your search criteria become available.
Already have an account? Login here.
Sign up with Facebook Sign up with GoogleOrCreate an account or login to create property alerts
Create an account or login to add properties to a wishlist. Sign up for property email alerts as soon as properties matching your search criteria become available.
Already have an account? Login here.
Sign up with Facebook Sign up with GoogleOr